Following on from my original post about radio meteor detection, I have produced a new set of conditional actions with additional features and improvements:
- Works with current versions of Spectrum Lab (tested with 2.96 b2).
- Bandpass filtering now works properly.
- Second spectrogram display now configured.
- Conditional actions can automatically upload image captures and log files to the web.
- Buttons reconfigured to automatically adjust bandpass filter to match the waterfall display.
- Easier Zooming, Scrolling and Offsetting of the waterfall display via Buttons.
- Numerous minor improvements and corrections.
Download MetScat_Comprehensive_v8.zip here.
Getting Started
If you are new to radio meteor scatter, I suggest you read my original post first as I won’t repeat the details of building an antenna as described in the Sky At Night Magazine article on Meteor Scatter by Paul Hyde, or the additional information I have provided on setting up an RTL2832U based SDR dongle (e.g. the NooElec NESDR SMArt) in Spectrum Lab.
Details of my setup and some useful information about the science of Meteor Scatter detection can be found in a presentation I have given, Meteor Scatter Detection -Advanced. The talk is also available on YouTube, but the notes in the downloadable presentation are more comprehensive. In this post I’m going to cover some further improvements I have made to my Spectrum Lab configuration and conditional actions. I will also cover setting up to upload data to the web.
Improved Spectrum Lab Conditional Actions V8
As previously described, the starter conditional actions which used to be available from the BAA were good for testing, but suffer from a number of deficiencies. They are also no longer available from the BAA site unfortunately. The improved conditional actions I have created address the issues of data quality and overall do a much better job of logging and screen capture, but they are more complex to set up. I have made further improvements and addressed a number of errors in the previous version of the configuration as set out in the changelog and known bugs and issues sections at the end of this post.
Installation
The new V8 conditional actions have been tested and work with Spectrum Lab version 2.96 b2. Earlier and later versions of Spectrum Lab may undergo functional changes which can impact the proper operation of these conditional actions. I highly recommend keeping a copy of the V2.96 b2 installation files, should you need to revert to them in case of unexpected problems with a subsequent upgrade. When upgrading, it is advisable to completely delete your Spectrum installation directory and start afresh. Remember to back up any configuration, ExtIO.dll or other files you have created first! Note that .USR and other configuration files are stored in directories within the Spectrum directory by default.
Download the Spectrum Lab MetscatV8 configuration files here.
IMPORTANT: If you have an existing meteor scatter (or other) Spectrum Lab configuration you wish to keep, use the Spectrum Lab ‘File -> Save Settings As..’ option to save them to a .USR file before proceeding. Then make a copy of that file somewhere else as a backup. Spectrum Lab can be a little erratic and it is possible to overwrite an existing configuration unexpectedly simply by closing Spectrum Lab.
In order to use this configuration open the ZIP file and proceed as follows:
- Copy Retune.exe to your Spectrum Lab executable folder. By default, the configuration file expects this to be ‘C:\Spectrum\Retune.exe’. If you need to copy the executable file elsewhere, once you have loaded the configuration, you will need to modify the
SpecLab_Pathconfiguration value in the File -> Conditional Actions window. - If you (wisely) do not trust the executable I have provided, you can create your own using the ‘Retune.ahk’ file. You will need a copy of AutoHotKey. Load the .ahk file, convert it to a stand-alone executable file and install as described above. The purpose of ‘Retune.exe’ is simply to programatically click the mouse in Spectrum Lab’s ‘vfo’ box and then programatically hit the Enter key. Spectrum Lab’s own interpreter will quite happily change the frequency display in the ‘vfo’ box, but there is no interpreter mechanism to force the SDR dongle to re-tune to that frequency so it is a misleading cosmetic change. The ‘Tune To’ buttons in the supplied configuration file call ‘Retune.exe’ to make the retune actually happen.
- Copy ‘Meteor_freqlist.txt’ to the ‘C:\Spectrum\frequencies’ folder (or the frequencies folder inside your Spectrum Lab installation folder if different). This will show the GRAVES and GB3VHF frequency markers on the spectrum display. If you do not see the blue GRAVES marker on the right side of the spectrum display after restarting Spectrum Lab, go to Options -> System settings -> Filenames, Directories, and Stream I/O. Check that Radio Station List: reads
frequencies\Meteor_freqlist.txtand then hit the Apply button. You may need to restart Spectrum Lab once more after this. - Copy ‘MetScat_Comprehensive_v8.USR’ to an appropriate location where Spectrum Lab can load it, such as your documents folder. Start Spectrum Lab and use ‘File – > Load Settings From..’ to load this file and configure Spectrum Lab.
- At this point you will need to check your SDR and other settings to ensure your SDR dongle is still working and correctly configured. It is beyond the scope of this post to explain how that is done. As a bare minimum check under ‘Options -> Audio I/O’ to ensure the correct ‘ExtIO_***.dll’ file is set as the source.
- Note: Spectrum Lab is able to automatically tune some SDRs, such as the NooElec NESDR Smart. Other SDRs such as the FunCube Pro+ must be tuned using their own frequency control program. See the instructions below on using the programmable buttons for more information.
- If you have an existing configuration that you wish to retain and only require the improved set of conditional actions, these are available in the ‘MetScat_Conditional_Actions_V8.txt’ file. These can be loaded in to the conditional actions tab using the ‘Load’ button without affecting any of the other settings. Note, there is no need to do this if you have loaded the full configuration at step 4 above.
- Optional: If you wish to upload capture or log files to the web, copy the ‘upload_ftp.bat’, ‘upload_sftp.bat’ and ‘upload_s3.bat’ files to your Spectrum Lab executable folder. (You only need the .bat file for the particular protocol you are using for upload). Note that you will also need to install a scriptable SFTP client to use SFTP, or the Amazon AWS CLI client to use S3. This is described below.
Configuration
Once you have loaded the new v8 configuration file in Spectrum Lab, you will need to get your SDR dongle up and running again. The configuration is set up for the NooElec NESDR Smart dongle, so you will need to check in Options -> Audio I/O and ensure you have the correct Input Device / Stream / Driver selected if you are using something else (probably a good idea to check it anyway!) You should also check the decimate input SR by value is appropriate for your device. I have set it to 64 in this new configuration as the NESDR’s 2.4GHz sampling rate is way too high. (If you are using the FunCube Pro+, the sampling rate is 192kHz and a decimate input SR by value of 8 has been shown to work quite well.) If you don’t know how to set up Spectrum Lab, please review my presentation here (especially the notes): Meteor Scatter Detection -Advanced
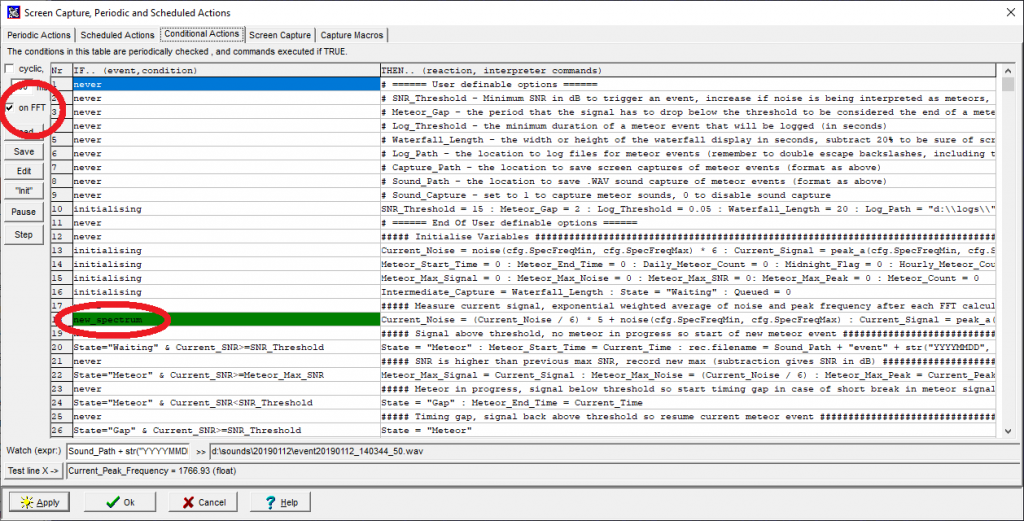
Once you are up and running, you can tune the conditional actions. If you open the conditional actions dialog via File -> Conditional Actions… you will immediately note that the Cyclic option has been disabled and the on FFT option enabled. This causes the new_spectrum condition to become true at line 46 each time a new FFT is processed. This line captures the key signal and noise data which is then monitored and used by the rest of the conditional actions.
The script is well documented with comments and uses meaningful variable names so that you can figure out what is going on. (As an aside, it’s the bane of my life that amateur software developers still use meaningless variable names like ‘a’, ‘b’, ‘c’, etc. making it painful to deduce how their code works!)
The activity of the script is controlled using the user-definable variables set in lines 8, 13, 22, 26, 30 and 33. These are documented in the preceding lines but remember that you need to click the Apply button and then the Init button to re-initialise everything before any changes become valid. The key ones that you may need to change are:
SNR_Threshold: This is set to 17 dB by default. You may need to increase it if you are getting too many false positive detections, or reduce it if you are missing meteors. Set the value to (say) 12 or 13 and you will hopefully see lots of events being detected. Look at the Peak SNR value in the waterfall label created for each event. Try to determine which are genuine meteors and which are noise artefacts and set the SNR_Threshold to a value just below the Peak SNR of the events you wish to capture and log.
Waterfall_Length: The configuration marks the waterfall display once a second along the bottom of the screen. Count the number of seconds that fit on to your display (look at the timing strip along the bottom) and subtract 20%. This will trigger the screenshot of a meteor when it is close to, but not at, the left hand edge of the waterfall display maximising the chances of capturing the whole event. Note that this has changed from a default of 20 to a default of 40 since the previous version of the conditional actions due to changing the FFT and Spectrum display parameters, doubling the effective timespan of the waterfall display.
Log_Path, Capture_Path, Sound_Path: Set the paths where you want to store your files. Note the use of double backslashes ‘\\’ as Spectrum Lab uses ‘\’ as the escape character in strings. NOTE: The folder must exist and be writeable by Spectrum Lab otherwise capturing / logging will fail silently until you fix the issue and restart Spectrum Lab.
SpecLab_Path: Set this to the location where you have installed Spectrum Lab, c:\\Spectrum\\ by default.
If you wish to upload screen captures and logs to a web site, see below as additional configuration will be required.
Code Layout
As the conditional actions model used by Spectrum Lab is headache inducing even for a seasoned professional software developer, the core of this script is a Finite State Machine with a number of other side actions queued or triggered using timers. Basically the State variable tells you (and the script) what is going on, whether waiting for a meteor, monitoring one, logging it, etc. The current state is also displayed near the bottom of the programmable button set on the main waterfall display, hopefully simplifying debugging of any problems.
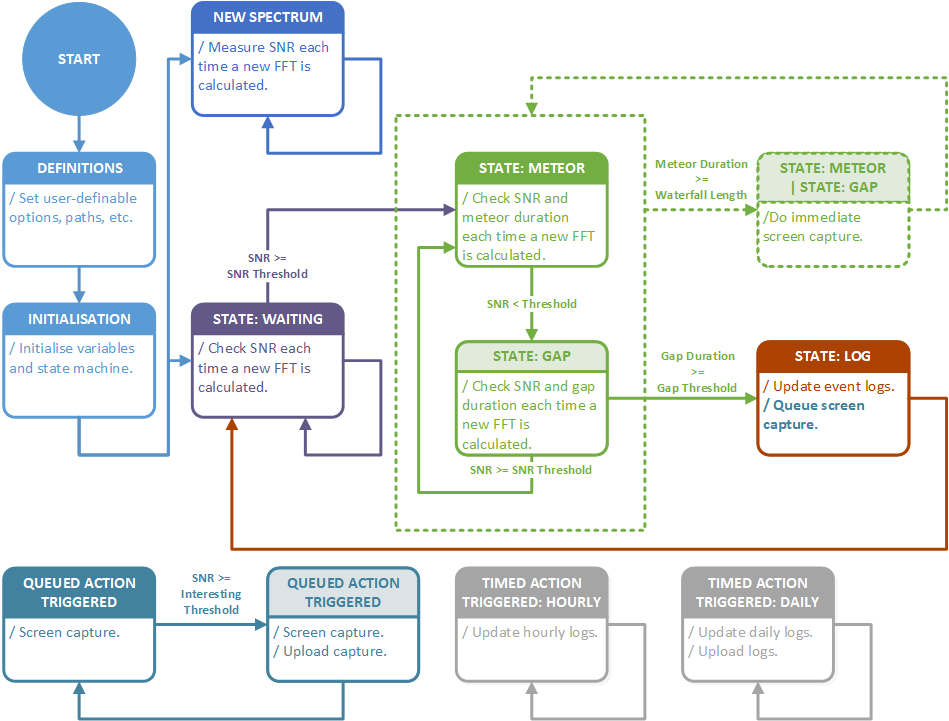
The main blocks of code are each demarcated with a comment such as ‘#### INITIALISATION ######…’. The flow of the code and the state transitions are documented in the diagram below. In summary:
- The user definable values are set and the code is initialised.
- The NEW SPECTRUM block runs each time an FFT is calculated to determine the current SNR, etc. and this data is used to drive the state transitions below.
- Simultaneously, the WAITING STATE monitors the SNR.
- When the SNR exceeds the user defined threshold, the METEOR STATE is entered.
- The METEOR STATE continues to monitor the SNR until it drops below the threshold when the GAP STATE is entered.
- If the SNR goes above the threshold again whilst in the GAP STATE, the METEOR STATE is re-entered, but if the SNR stays below the threshold for a user defined gap period, the meteor event is considered over and the LOG STATE is entered.
- Whilst in the METEOR STATE or the GAP STATE, the duration of the meteor event is monitored. If it exceeds the user defined waterfall length, a screen capture taken immediately to capture parts of the event that would otherwise scroll off-screen. If necessary this will happen multiple times during a long event.
- In the LOG STATE, the log files are updated with the recorded data for the meteor event and a screen capture is queued to happen in the future when the on screen event has scrolled near to the left edge of the screen according to the user defined waterfall length. The WAITING STATE is re-entered ready for a new meteor event.
- Separately, Spectrum Lab monitors the Queued Events created by the LOG STATE. When the relevant time is reached, the event is pulled from the queue and the QUEUED ACTION TRIGGERED section creates a screen capture.
- If the event’s SNR is above the user defined upload threshold, a second screenshot is taken and it is uploaded (see below for details of configuring the upload process).
- Separately the TIMED ACTION TRIGGERED: HOURLY and TIMED ACTION TRIGGER: DAILY sections occur once per hour (just before the top of the hour) and once per day (just before the midnight) respectively. These update the relevant log files.
- The TIMED ACTION TRIGGER: DAILY section also uploads the log files (see below for details of configuring the upload process).
Uploading to the Web
Note: I use Amazon S3 to host the content for this web site, and thus I have comprehensively tested my setup using S3. I have provided some extra configuration examples for uploading files directly to a web server based on an example of FTP upload from the Spectrum Lab documentation. Bearing in mind that FTP is generally deprecated as it is insecure, I have also provided an example for WinSCP which uses SFTP. I am not in a position to test the FTP or SFTP examples I have provided, so you should view them as a starting point to make the necessary modifications to your setup rather than a working product. Please understand I can’t advise you on the specifics beyond the examples provided.
I assume you have a working web site and some means of uploading files to the site. This is not a guide to setting up a web site, setting up an SFTP server or client or using Amazon Web Services. It merely documentation on how to upload files automatically when triggered by the conditional actions for those who know what they are doing!
Step 1
You will need to decide how to upload your files and have an appropriate server on your web site ready to receive them. I have provided three example configurations:
- Uploading using simple FTP to an FTP server. This is insecure and not something you should be doing in the modern age, as the username and password for your uploading account (probably an important one!) passes across the Internet as plain text, as does all of your uploaded content.
- Uploading using SFTP to an SFTP server. This is secure and a much better idea, though it is a bit trickier to set up the server and client. If you have a working web site you probably have access to these features.
- Uploading to Amazon Web Services, specifically the S3 service. This is the method I use.
Step 2
You will need a working client on the Spectrum Lab PC to perform the upload, and of course it will need to be able to access your upload server:
- FTP uses the default windows FTP command. This requires no setting up other than configuration in the conditional actions as describe below, but it is insecure.
- SFTP uses the free WinSCP client. You’ll need to install this on your Spectrum Lab PC configured with your SFTP server by creating a connection, importing keys, etc. Read the manual!
- Amazon S3 uses the free AWS CLI which needs to be installed and configured on your Spectrum Lab PC and configured to work with your S3 bucket by running
aws configure
Step 3
You will need to copy one of upload_ftp.bat, upload_sftp.bat or upload_s3.bat to your Spectrum Lab directory. This is the Windows batch file that the conditional actions will call (using the exec() command) to upload files when required.
Step 4
Configure the relevant upload options in the DEFINITIONS section of the Conditional Actions window. If you right-click the relevant batch file from step 3 and Edit it, you will see documentation in the comments explaining exactly which of the options you need to change in the Conditional Actions window for that file to work. Remember to Apply and Init the conditional actions after any changes.
Note: Spectrum Lab uses \ as the escape character in the interpreter. So when entering paths in the configuration such as c:\Spectrum\ you need to put c:\\Spectrum\\ This also applies if there happens to be a backslash in your SFTP_Hostkey.
Step 5
Each time Spectrum Lab needs to do an upload, it will call the configured batch file and pass up to 9 parameters to it. The same 9 parameters are passed in each case, but only some of them will be used by each batch file and the others ignored.
The FTP and SFTP examples first create a small script file and then execute the FTP or WinSCP command, passing that script file to the program to connect to the server and upload the relevant file. The S3 example just calls aws s3 directly with a few of the parameters.
Note: All of the parameters are passed to the batch files enclosed in double quotes, and referenced in the batch file using %~1, %~2, etc. Using %~1 instead of %1 strips the double quotes again. Hopefully this will deal with any issues around paths or other parameters containing spaces or being empty.
Features
The conditional actions script provides the following features:
- Captures screenshots of meteor events from the waterfall display. For events that are longer than the width of the waterfall, the script will attempt to capture multiple intermediate screenshots to ensure the whole event is recorded. The script also queues screen captures to capture each meteor event, whereas some scripts would miss subsequent events if one meteor is already scheduled for capture.
- Captures .wav sound files of meteor events, which can be enabled or disabled via the user defined variables in the script.
- Creates multiple log formats, logs can be opened by other applications (e.g. Colorgramme) whilst Spectrum Lab is active without file locking issues:
- RMOB.dat and RMOB-dur.dat formats for upload to RMOB.
- daily_log.csv and hourly_log.csv formats containing simple daily and hourly meteor counts.
- event_log.csv format containing comprehensive data for each captured meteor event. The comma separated columns are:
- Meteor Start Date (YYYY/MM/DD)
- Meteor Start Time (hh:mm:ss)
- Current daily meteor count (integer)
- Peak Meteor Signal (float, dB)
- Peak Meteor Noise (float, dB)
- Peak Meteor Signal to Noise Ratio (float, dB)
- Peak Meteor Frequency (integer, Hz)
- Meteor Duration (float, seconds)
The programmable buttons on the left of the main waterfall display provide the following functions:

- Last Event: Last event that occurred (no function when clicked).
- Capture Now: Captures a screenshot of the waterfall display immediately to the Captures folder in the Spectrum Lab folder (potentially not the same as the Captures folder you specified in the conditional actions!)
- Pause: Pauses the waterfall display and processing.
- Tune to GRAVES: Tunes to the GRAVES frequency.
- Tune to Test Beacon: Tunes to the GB3VHF frequency. This is useful for some UK-based observers to test their equipment. If you are in range, you should see an alternating pattern of continuous single frequency, a dashed (Morse code-like) single frequency and then series of dashes shifting over a small range of frequencies.
- Note: The waterfall Zoom, Frequency Scroll and the bandpass filter are no longer adjusted automatically when using either of the tuning buttons. This is by design. If you wish to return to the default view, see the Reset View button below.
- IMPORTANT: Spectrum Lab is able to automatically tune some rtl2832u SDRs via their driver, such as the NooElec NESDR Smart. Other SDRs such as the FunCube Pro+ and similar dongles that appear as a sound device in the Windows control panel must be tuned using their own frequency control program. If using such a model, after clicking one of the Tune To buttons, you must also adjust the tuned frequency in the external frequency control program before you will detect anything!
- Logging: Toggle logging of meteors, screenshot and sound captures on and off.
- Signal Gen: Toggle injection of a strong signal in to the FFT. Useful for testing script triggers, etc.
- Display Up / Down: Scroll the displayed frequency range up or down by a small amount. Use these buttons rather than the standard Spectrum Lab display controls in order to adjust the bandpass filter to match.
- Offset Up / Down: The tuning of the SDR dongle is affected by its temperature, and these controls change the ‘Radio Frequency Offset’ found on the ‘Spectrum (2)’ tab to compensate. When you get a nice static meteor trail on screen (i.e. one that isn’t broken up or drifting in frequency), use these buttons to adjust the position of the blue GRAVES marker in the frequency scale so that it is aligned with the centre of the trail. This should correct for any tuning inaccuracies until the temperature changes significantly.
- Note: If you use the Offset buttons, you may also need to use the Display Up / Down buttons to re-centre the GRAVES marker on the screen. Offset changes apparent tuning of the SDR by shifting the frequency scale display. Display does not change the tuning, merely where the tuned frequency is shown on screen.
- Note: Offset adds or subtracts the set value from the frequency scale displayed on screen. It does not change the physical tuning of the SDR in any way.
- Zoom + / –: Narrows or widens the frequency range shown on screen. The minimum bandwidth you can zoom in to is 200Hz wide.
- Note: The maximum bandwidth is not capped, but bear in mind that the sample rate of your SDR and any decimation you have applied will impose a maximum upper limit on the bandwidth that can be monitored!
- IMPORTANT: The Display Up / Down, Offset Up / Down and Zoom +/- buttons will automatically calculate the centre frequency and the bandwidth displayed on the main waterfall display and shift the Center/cutoff [Hz] and bandpass [Hz] values in the filter window in order to maintain the correct bandpass. The filter is not adjusted, if you scroll or zoom the frequency range using the manual controls near the top left of the waterfall display, and if you do use them the the filter window won’t match what is on screen.
- Note: The currently displayed frequency range is shown on the Zoom + button (Rng:). The current filter Center/cutoff [Hz] and bandpass [Hz] are shown on the Zoom – button (Fltr:).
- Reset View: This resets the waterfall Zoom, Frequency Scroll, Offset and the bandpass filter to the default of 1kHz wide centered on 2kHz with zero offset and a matching bandpass filter. If you mess up your display, click this button and all should go back to normal.
- SNR: Displays the current peak SNR being read from the FFT for diagnostic purposes. Also shows the numeric values set by the (B)rightness and (C)ontrast sliders controlling the waterfall display.
- DMC/HMC/Q: Displays the current daily meteor count, the current hourly meteor count and the number of screenshots currently queued for capture.
- State: Displays the current state of the Finite State Machine in the conditional actions.
- Note: the vfo, SF and Time buttons have been removed in this version as they were somewhat redundant and so removing them freed up buttons for other uses.
Changelog:
- Now tested and compatible with Spectrum Lab V2.96 b2. The issues with internal Spectrum Lab
cfgvariables not being accessible in some versions after V2.93 b8 have been addressed in the newest version, but some other quirks have cropped up since I created the original configuration. - When printing the meteor event label on the waterfall display, the command has been changed from
sp.print("<insert event details here>")to becomesp.print(t=sp.time, "<insert ...This is due to an apparent change of functionality in Spectrum Lab V2.96 b2 (and possibly earlier). If the default statement is used, equivalent tosp.print(t=now, "<insert ..., there can be a significant delay to the marker appearing on the waterfall, as much as a minute or more after the event has scrolled off the display. This is due to the FFT processing lagging behind real time. So the hidden defaultt=nowsetting will only print the label once the waterfall display reaches the current clock time, rather than just after the event being detected which is not what we want. - When printing the meteor event label on the waterfall display, the font attributes for the label have also been set explicitly, and should be changed in the relevant line of the conditional actions:
sp.print(t=sp.time, fn="Arial", fs=14, fc=0xFFFFFF, fa=0, "<insert ... - The meteor event label on the waterfall display has been updated to make it clear that it shows the UTC Start Time of the meteor event.
- The meteor event label on the waterfall display now includes the peak SNR of the meteor event. You can exclude events from being logged or captured by adjusting the
SNR_Thresholdvalue in the Conditional Actions to be greater than the labelled value. Conversely, if events you wish to capture are being missed, reduce theSNR_Thresholdto just above the noise floor (probably at or around12 or 13) and then adjust upwards again from there by looking at the peak SNR values displayed on the waterfall event labels. - The screen capture configuration has been updated to make it clear that the label in the top left corner is the UTC time that the screen capture was generated, NOT the time of the meteor event. There can be a difference of many minutes between the two values depending on how far the FFT processing falls behind real time.
- The settings in the Components window have been updated to feed the output of
L4to Spectrum Analyser 1. The previous version of the configuration file was feedingL1(after decimation) to Spectrum Analyser 1.- This means that the bandpass filter set up between
L3andL4is now effective, whereas previously it had no effect on the data displayed in the main waterfall. - It is also now possible to click on the amplifier (blue triangle) between
L4andL5and then adjust the DAC (audio output) gain directly using the slider on the right hand side of the Components window without affecting the waterfall display - As the Components -> Filter Control Window now effectively applies a default bandpass filter which is about 1kHz wide centered on 2kHz, only signals that physically appear on the main waterfall display are monitored and logged by the conditional actions, etc.
- The Display Up / Down and Offset Up / Down and Zoom + / – buttons will now calculate the centre frequency on the main waterfall display and shift the filter Center/cutoff [Hz] and Bandwidth [Hz] of the filter to match the display. Note that if so if you zoom the frequency range in or out or shift it up or down using the manual controls near the top left of the waterfall display, the filter won’t match what is on screen. The current filter range (Rng) and Center/Cutoff / Bandwidth (Fltr) are shown on the zoom buttons.
- This means that the bandpass filter set up between
- To assist in tuning the brightness and contrast of the main waterfall, the Brightness (B) and Contrast (C) values are displayed numerically in the button that also shows the current SNR value.
- The default decimation, FFT input size and overlap settings have been changed in the Options window. You will likely have to adjust them yourself for your own PC and dongle’s capabilities, but I have proceeded as follows:
- On the Audio I/O tab, the NooElec NESDR produces a Nominal Sample Rate (in) of 2.4MHz. This is excessive, and so I have set the decimate input SR to 64, which reduces the sample rate to 37,500kHz which is more than sufficient for our purposes. By decimating significantly at this stage, the workload for the subsequent operations in the pipeline is greatly reduced. There is little point in filtering and amplifying a huge number of samples only to throw them away at the Spectrum Analyser stage.
- Accordingly, on the FFT tab, I have left the Decimate input by (divisor) value set to 1, as we have sufficiently decimated the samples at the I/O preprocessor stage above. I have set the FFT input size (“length”) to 8192 and the FFT window function to Hann.
- On the Spectrum (1) tab, I have set the % overlap to automatic and 87.5. The net result of these settings is:
Effect of FFT settings with fs= 37.5000 kHz:Width of one FFT-bin: 4.57764 HzEquiv. noise bandwidth: 6.86646 HzMax freq range: 0.00000 Hz .. 18.7500 kHzFFT window time (length): 218.5 msFFT window overlap: 87.5 % (automatic)
- This provides a reasonable compromise in terms of both frequency resolution and time resolution whilst keeping the application responsive. By adjusting the Decimate input by (divisor), FFT input size (“length”) and % overlap values, one can trade frequency resolution (
Width of one FFT-bin) against time resolution (FFT window time) on the main waterfall display.
- I have properly configured the Second Spectrogram (enable and view from the Components menu).
- This has been set to show a 4kHz band centered on the tuned
fc(centre frequency). This is useful in diagnosing any issues if you are not seeing meteors, e.g. if they are falling outside the much narrower frequency range displayed on the main waterfall. - In order to populate the much wider frequency band,
Spectrum Analyser 2is fed fromL1on theComponentswindow, i.e. prior to bandpass filtering. It may also be useful for tracking ISS radar echoes which can be Doppler shifted outside the typical range for meteor echoes. - I have also increased the decimation further by setting Decimate input by (divisor) to 2 on the FFT properties tab for the second spectrogram. This greatly increases the timescale covered by the second spectrogram, and gives a result of:
Effect of FFT settings with fs= 18.7500 kHz:Width of one FFT-bin: 2.28882 HzEquiv. noise bandwidth: 3.43323 HzMax freq range: 0.00000 Hz .. 9.37500 kHzFFT window time (length): 436.9 msFFT window overlap: 87.6 % (automatic)
- I have also enabled TIME-reassigned spectrogram display and FREQUENCY-reassigned display on the Spectrum (2) tab for the Second Spectrogram only. This gives a much finer resolution for the plot, but at the expense of making it hard to see low SNR events. You may wish to experiment with turning on these settings for Analyser 1 on the main waterfall display, but there are a number of caveats to be aware of.
- This has been set to show a 4kHz band centered on the tuned
- The Tune to Graves and Tune to Test Beacon buttons have been modified. They will look for Retune.exe in
SpecLab_Path(which defaults toC:\\Spectrum\\). This can be changed in the conditional actions window and is one of the user defined options in the Upload section.
Known Limitations, Bugs and Issues:
- In order to capture multiple meteor events in quick succession, it is necessary to use Spectrum Lab’s
queue_eventfunction andqueued_eventtrigger. There appears to be no mechanism by which data values can be stacked when queueing an event for later retrieval when the queued event triggers (e.g. one would typically use a circular buffer in an array data structure, but the SL interpreter does not have an array data type for user defined variables). Thus it is currently impossible to name screen capture files or sound capture files with the time of the event. The best that can be done is to label them usingnow(the UTC time the file is created).- This makes it impossible to programatically cross-reference capture files with entries in the log files, although the “Event Start Time” printed on the waterfall screen should match the Event Start Time in the log file. Unfortunately this means cross referencing can only be done by hand. Whilst it might be possible to estimate time that the queued event will trigger and record it in the log, this might still be out by a second or two each way so has not been implemented.
- For similar reasons is is not possible queue multiple “interesting” events for capture and upload to the web if they happen in quick succession. When an “interesting” event (i.e. that exceeds
Upload_Threshold) occurs, the next event in the capture queue will be captured and uploaded regardless of whether it was the “interesting” event or a slightly earlier “normal” event. This may lead to some “interesting” events being truncated if they are still near the right side of the waterfall display.- Similarly if a second “interesting” event triggers whilst the first one is still queued for capture, only the first event will actually be captured. Again this should not be a major issue as the second “interesting” event should also be on the same waterfall capture, albeit it may be truncated.
- For the avoidance of doubt, this is only an issue for uploading “interesting” events when multiple events are detected within the same “window” of time defined by the
Waterfall_Lengthconfiguration value in the conditional actions. Bear in mind that every event is captured individually in theCapture_Pathdirectory regardless of any issues with the copies captured in theUpload_Pathdirectory.
- I have disabled sound output by default, as it can stall Spectrum Lab or lead to very slow performance if it is not configured properly. If you wish to enable audio output on your configuration, you need to undertake the following steps:
- Under Options -> Audio I.O you must check use different sample rate for output: and set nominal: to
44100or48000S/s (depending on your sound output device – experiment with both). This will ensure that the output rate for audio playback matches typical Windows audio devices (See 3 in the diagram below). - Also under Options -> Audio I.O you must choose the correct Output Device / Pipe / Driver. Click the select list down arrow and choose
-1 Default WAVEoutput. This should use whatever sound output device you have set in Windows. You may need to experiment with choosing a specific device in the list if this does not work.
- Under Options -> Audio I.O you must check use different sample rate for output: and set nominal: to

- In the Components window, click the DAC box and choose Enable to switch on audio IO (see 1 in the diagram below). If the DAC box turns green , and stays green, and you can hear sound output on your speakers (click the Signal Gen button to test) you’re good to go. If the DAC box turns red immediately or after a short while, you may need to reduce the nominal: rate that you set above to avoid overfilling the output buffer.
- If you still hear no sound, in the Components window you may need to increase the output gain. Choose
Left Filter output amplifierin the dropdown at the bottom right of the Components window, and then input a gain value in dB in the box below (see 2 in the diagram below). A value of36makes meteors audible in my setup whilst supressing background noise, but your mileage may vary. - You can also adjust the audio gain by clicking the triangle between L4 and L5 and then using the slider at the right of the Components window. The first adjustment is within a range of +10dB to -10dB, but if set to +10dB the slider range then changes to +100dB to -100dB (with no visual indication!) It’s a bit confusing which is why I use the method above.
- If you still hear no sound, in the Components window you may need to increase the output gain. Choose

- Occasionally ‘Retune.exe’ does not work when the Tune to.. buttons are clicked. If you suspect this is the case, manually click in the vfo box and hit the enter key. Also bear in mind the comments above the need to use external programs to tune ‘sound card’ type SDRs.
- The timestamps displayed on the bottom of waterfall may be significantly behind real time. This is due to the amount of data SL has to process and depends on your sampling and FFT settings, as well as the processing power of your PC. The displayed time of a meteor event both on the timestamps and on the event label should reflect the actual UTC time the event was detected.
- Timings for creation of RMOB log files are not defined anywhere I can find easily. The supplied conditional actions create RMOB log entries for the past hour at just before the hour ends, i.e. the count of meteors between say 23:00:00 and 23:59:59 will be timestamped for 23:00. Many, but not all, other observers seem to be using scripts which would stamp that entry 00:00 on the following day, which doesn’t make sense to me; if you filter log entries by date, the last hour’s data for a day would appear in the dataset for the following day! It is easy enough to adjust the log trigger times if you prefer the other convention.
Hi Ian
After a lot of tinkering yesterday I gave up trying to get this to work via SDR# and VB Cable. However, this morning I read your “Meteor Scatter Detection” Powerpoint document and used ExtIO_RTL2832.dll and bypassed SDR#. I’m using NooElec NESDR SMArtee dongle and it has detected a couple of meteors. However, I’m experiencing “gaps” in the waterfall (please forgive my ignorance with technical terms) where the signal appears to almost vanish before returning. I can’t upload a screenshot here but I’ve taken the liberty of sharing a link to the screenshot so you may take a look, after all a picture is worth a thousand words! https://www.amazon.co.uk/clouddrive/share/xjPL2Wr7NPnjYqtEelJf2uXPnuwUNHwQdc0d6brmgDu
Do you have any idea what could be causing this issue please?
Thank you.
I see something similar but less extreme on my setup, with a slight band of noise for a couple of seconds every 30 seconds or so. It’s not as noticeable on my setup as it is less frequent, and only just above the noise floor. I have set the waterfall contrast and brightness such that it is not that apparent, and it is well below the SNR threshold so doesn’t trigger any false positive detections.
I don’t know the reason for it, as it wasn’t apparent on the previous configuration, only in this new V8 config (which is also running on the latest version of Spectrum Lab which may also affect things I suppose). Things you could experiment with (one at a time, reverting the others to current settings):
– On the Components window, set Spectrum Analyser 1 to take its feed from L1 (before bandpass filtering) rather than L4. This is how my previous config worked. There is some risk of false positives if there are strong signals on nearby frequencies, but it wasn’t an issue for me over several years so worth a try. It might be the filtering process is introducing noise somehow.
– Try changing the decimation factors. I use 64 (Audio I/O tab) and 1 (FFT Tab) to give a net 64 x 1 = 64. You might try using 32 and 2 (32 x 2 = 64). This would give the same time and frequency resolutions on the waterfall display, but the filter would then be fed with more samples which might help. Bear in mind 64 is the value that works for me, you don’t have to stick with 64 – whatever works for you is fine but bear in mind changing the net decimation value affects the time and frequency resolution achievable on the waterfall.
– Try changing the FFT input size and FFT window function settings on the FFT tab, plus the % overlap value on the Spectrum (1) tab. These are the other key settings that drive the calculation of FFTs and resulting appearance of the waterfall display. It might be that there is some kind of aliasing going on with specific settings that is causing excess energy to be dumped in to the display at certain points where FFT windows overlap but it’s hard to know.
Overall I can only advise you to experiment with the settings in a systematic way noting your findings as you go. Don’t forget to consider that the cause might be genuine RFI from nearby electrical sources (power lines, passing vehicles, lawnmowers, household appliances and electronics, mobile phone in your pocket, etc.) Given that you have to have a PC nearby and hooked up to the dongle and antenna, that would be a prime suspect (PC, power supply, display, etc.)
Thank you for your comprehensive response Ian. I will try all these things. Pleased to say though that I have still captured a few meteors during these bands, so performance doesn’t appear to be impaired.
Actually, I should just add, that I’ve just noticed the waterfall speed increases during the darker bands (with ?less noise) and is slower during the lighter bands (with ?more noise). So effectively the darker bands appear graphically less dense. This may simply be a processing power issue on my laptop perhaps.
Hi Ian,
I have a question about the S-N value. I’ve set it to various values (12 thru 24) in your V8 usr-file and I’m still getting several false captures. I’ve even increased that value to 100 as a “test” to see what happens, and I still get lots of captures. It’s almost as if the value I put there isn’t working at all?
Any clue as to what might be going on here?
Also…..is there a way to display on a regular basis the actual S-N level in SL? Or perhaps a displayed value of the average S-N level? Is it already displayed or available and I just don’t see it?
Hopefully I’ll be able to see what range the S-N level is as the program is running, and I can then adjust the value in the script accordingly.
However, I posted this question in the V7 version, and your suggestion was there is a “Peak SNR” displayed in the waterfall with each capture. But all I’m seeing is the “Date”, “Time”, and “Freq”. Where can I change that element of the capture to actually put the “Peak SNR” and “Max SNR” on every capture?
Thanks a million!!
-john
Hi John,
The “Peak SNR” is displayed as part of the text printed vertically on the waterfall next to each capture. If you’re not seeing it, I can only suggest that you haven’t loaded the newest set of conditional actions since it is hard-coded in there. Spectrum Lab can be a bit weird about loading and saving configurations, so what I always do is open it, load the conditional actions I want, and then save them back to the same filename as you just loaded. Exit Spectrum Lab and restart it, double check that it has now loaded the correct configuration by looking at the conditional actions window. I don’t know why the SNR thresholding isn’t working for you, it’s a pretty simple logic test so maybe it is related to the wrong actions being loaded. Don’t forget that you need to click the “Apply” and “Init” buttons in the conditional actions window each time you change something otherwise the old values will continue to be used.
Thanks for your reply, Ian.
I’ve found some cures to my problem(s).
1st of all, I am in the USA’s Midwest (Indiana), and using the 82.310 MHz DTV ch-6 Pilot carrier as a source. Unfortunately, we do not have a Graves-type source to work with here….at least not that I know of. Furthermore, the noise levels and signal levels are probably different than what you folks get with Graves. BTW…I’m using a NESDR Smart Dongle.
Below are the Button scripts I’ve come up with to include on my personalized SpecLab, and once I saw what range the “Current-SNR” was in, I could see my problem; my threshold setting has to be in the 125-130 range to get the event labels to actually appear. Why? Beats me. But once I started with that change, the display of events began appearing when the threshold was exceeded. To be honest, I was shocked to see it!! And very happy, too!!
However….there is one odd thing happening as the display continues to the left (as in my setup) – letter trails. I have no clue what’s causing that. See this video on my YouTube page:
https://www.youtube.com/watch?v=Pz24lZouUdo
Button 9’s string xpression is the result of my desire to see a number (regardless of “sign”) that displays the difference between the Signal level and the SNR-level, so that string xpression I came up with seems to fit my need.
One xpression I tried, and then removed, for Button 12 was what seems to be the raw “noise” figure. That number was always in the ” -1,300 ” range. I included that button 12 string below.
Again, thank you for your help, and patience.
-john
==============================================
Button 6
“SNR_Threshold at “+str(“###0.00 dB”,SNR_Threshold)
Button 7
“Current_SNR at “+str(“###0.00 dB”,Current_SNR)
Button 8
“Current_Signal at “+str(“###0.00 dB”,Current_Signal)
Button 9
“Diff: SNR-Signal at “+str(“###0.00 dB”,(Current_SNR + Current_Signal))
Button 10
“Hourly # Since Last Start=”+str(“###0”,Hourly_Meteor_Count)
Button 11
“Daily # Since Last Start=”+str(“###0”,Daily_Meteor_Count)
Button 12
“Current Noise at “+str(“###0.00 dB”,Current_Noise)
=============================================
Hi John,
Glad you’re making progress. The only thing I can add is that the repeating “letter trails” are some sort of Spectrum Lab issue. I get them from time to time on my setup, particularly after resizing the Spectrum Lab window. I don’t know the cause or have a consistent cure for it.
hi i have followed your tutorial, please could you confirm how i get screen capture to work, being a stonemason its a miracle that i have got this far
Sorry for the delay, not getting notified of new comments again! In the File -> Conditional Actions dialog, look for Capture_Path . Set the path where you want to store your files. Note the use of double backslashes ‘\\’ as Spectrum Lab uses ‘\’ as the escape character in strings. So to store captures in C:\Captures\ you’d set Capture_Path to C:\\Captures\\ . The Captures folder must exist and be writeable by Spectrum Lab otherwise capturing / logging will fail silently until you fix the issue and restart Spectrum Lab.
Hello Ian,
Thanks for explaining all the settings in SpectrumLab. And for posting your .usr file.
I would like to use your .usr file to see if I can catch meteor-scatter from the new UK meteorbeacon at 50.408 Mhz.
I am intend to use a NESDR smart V4 dongle. Any special settings to make to get it to run on your .usr file?
Many thanks and kind regards,
Kees
(west of the merian, NL)
I think you would just need to adjust the frequency you are tuning to. For Graves it is 143048017 Hz, but for the new beacon it would be 50408000 Hz or thereabouts. If you right click the ‘Tune To GRAVES’ button you can edit the settings it applies. I’m not sure what else you might need to change as I’m unable to test this at the moment.
High Ian,
Thanks for your quick reply. With a NESDR, is there somewhere a gain setting? And it looks like the setting of the bandwidth is fixed on the NESDR to 2.4Ghz, and will effect the FFT waterfall. Not clear to me how to match i.e 192Khz / 8 (for a funcube dongle pro) with the 2.4Ghz with decimation of 64. Which output are we looking for?
Many thanks and best regards,
Kees.
Hi Kees,
The gain settings for the NESDR are under the Configuration and Display Control Dialog, Audio I/O Tab. Top left the Input Device should be set to the ExtIO_RTL driver .dll supplied by the device manufacturer. Below this click the Ctrl button (with a little “hand” icon). The the Audio-I/O Selection for Spectrum Lab dialog that opens, you again should see the Input DLL with the name of the ExtIO driver dll. Click the little “hand” icon button to the right of it, and the device control panel opens.
For the NESDR make sure Tuner AGC is checked, RTL AGC is unchecked, Offset Tuning is checked. Frequency correction could be changed to calibrate the device a bit better, but because it is so temperature sensitive I don’t usually bother. Instead wait for a long (non-drifting) meteor trail and then use the Offset Up/Down and Display Up/Down buttons on the waterfall to centre the trail on the GRAVES (or other source) frequency. None of the other controls on this dialog should be operative.
The FunCube captures 192,000 samples per second, and we decimate that at the Preproc stage by 8 to send 24,000 samples per second to the analyzer. The NESDR captues 2,400,000 samples per second, and is decimated by 64 to send 37,500 samples per second to the analyzer. (Open the “Components” window in Spectrum Lab, Preproc is the second box from the left, right click it and you can change the decimation value to suit your device).
Next we divide the samples per second by 2 to determine the maximum bandwidth we can analyze (Nyquist theorem). So with the above decimation settings for the FunCube we can analyze a frequency range 12,000Hz wide and for the NESDR 18,750Hz wide.
The tuning setting of the SDR determines the lowest (starting) frequency in the range, and for the FunCube the tuning is set by the FunCube’s control program, for the NESDR it can be set directly in SpectrumLab in the vfo box on the main page (or using the programmable button and retune.exe which I have set up as described in the main article).
The default bandwidth displayed in the main waterfall in my supplied configuration is 2,000Hz wide. You could use the Zoom- button to increase the displayed bandwidth range as required. Hopefully it is obvious that if you zoom out more than the frequency range determined by the device sampling rate, decimation value and Nyquist you won’t see any data outside the maximum range.
You can of course adjust the decimation factor at the Preproc range to suit yourself. It is also possible to set a decimation value on the Configuration and Display Control dialog, under the FFT Tab in the Decimate input by (divisor) box.
I have left this at 1 and done all the decimation at the Preproc stage as I don’t see any benefit from processing lots of samples only to throw them away at the FFT stage of the pipeline. But, for example with the NESDR you could set decimation at the Prepoc stage to 32, and then set it to 2 at the FFT stage to get the same result as above (2,400,000 / 64 = 2,400,000 / 32 / 2).
The important thing to keep looking at is the box at the bottom left of the FFT tab, the “Width of one FFT-bin” value tells you how many Hz are covered by each frequency strip on the vertical axis, and the “FFT window time” tells you the width of each time strip on the horizontal axis (in milliseconds). As you adjust the decimation and other values such as FFT input size and overlap, you essentially trade increasing resolution on the frequency scale for decreasing resolution on the time scale (or vice-versa).
Hello Ian,
thanks for your extensive explanation. It starts to like like a Spectrumlab workshop. I found al the settings now and see how to control the NESDR.
Now it will be a matter of setting the right frequency and scale.I am used to use a receiver mode on other SDR software, like CW or for meteorscatter I use USB. Is this not necessary to set somewhere?
And one more small thing about Spectrumlab; on my laptop screen the lower buttons fall outside the screen. Even on my highest resolution. Any idea how to get the ‘complete’ Spectrumlab window a my screen? So many settings, it is a love/hate relationship really, but when the meteor-reflections becoming visible I love it!
Many thanks and kind regards,
Kees
The screen layout is determined by SpectrumLab, so if it is not fitting your screen I’m not sure what you could do here. I don’t know if you can change your Windows resolution or display scale to make it fit.
The frequency is set automatically for RTL2382u SDRs as SpectrumLab can set the frequency for these directly over the USB connection. For other SDRs you will typically have to set the frequency using whatever control software the manufacturer supplies and then set SpectrumLab display to correspond (or vice-versa).